

Fashion PDP Hesitation: Metrics That Matter
Size switching, guide opens, gallery loops, and long dwell can signal hesitation, or not. The fashion PDP metrics worth tracking, and how to read them honestly.

Hesitation on a fashion product page shows up as repeated evaluation without commitment: size selector changes, size guide opens, image gallery loops, scrolling back to reviews, and exits after long dwell, plus rage or dead clicks when the page itself gets in the way. No single metric proves hesitation. Pair these events with qualitative evidence such as recordings and customer questions, read them by SKU, and treat long sessions as a question, not a win.
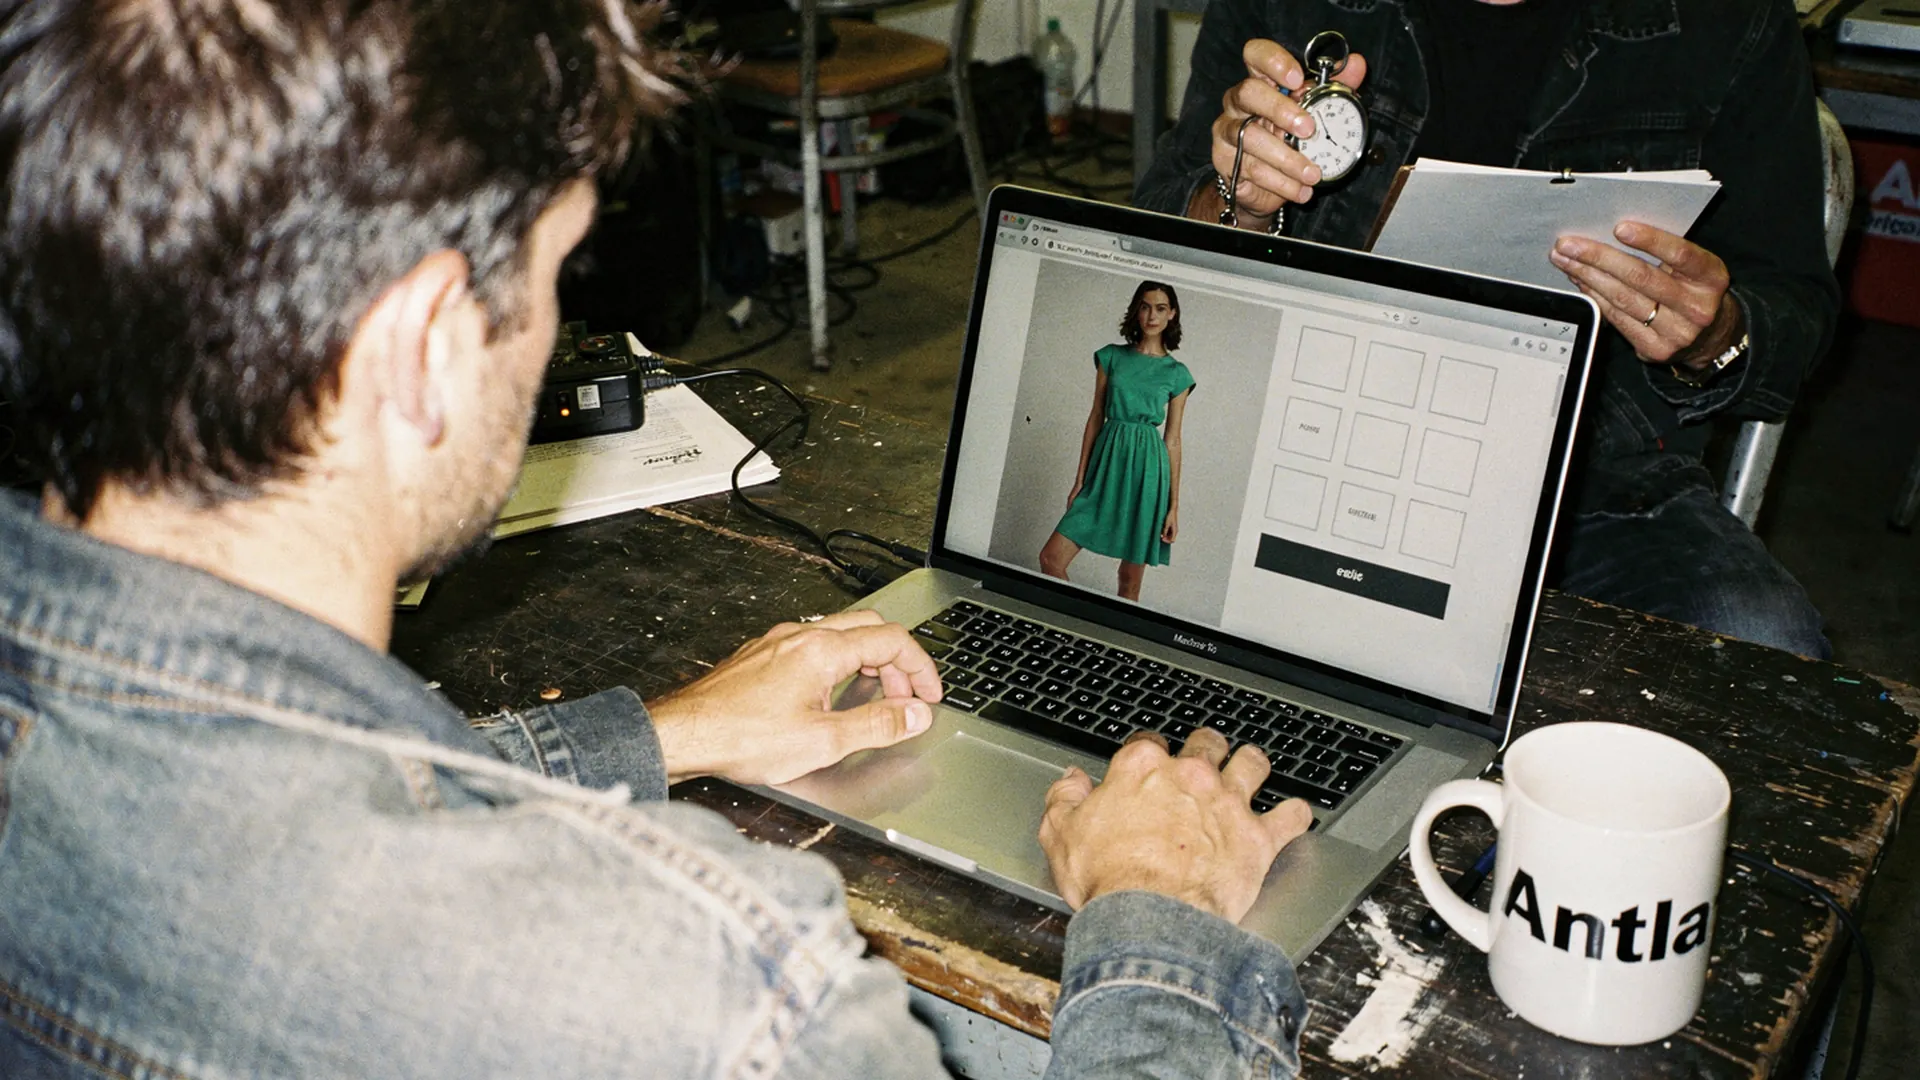
One person shops, one person watches the clock. The pauses say more than the clicks. Editorial image in Classic Antla disposable-camera style.
Hesitation costs sales on a fashion product page, and standard reports barely see it. The shopper is interested enough to stay and not sure enough to buy. Default analytics reports the outcome (no cart) and the duration (a long session), which are exactly the two numbers that cannot tell you what happened in between.
What follows is the measurement plan I would hand an analyst: what to instrument, how to check it against what shoppers say, how to read it by SKU, and how not to fool yourself with session length.
Define hesitation signals
A working definition: hesitation is repeated evaluation of the same decision without progress toward it. The shopper keeps checking the size, the photos, or the reviews, and never commits. That definition matters because it rules out a lot of behavior that looks similar, such as a shopper happily browsing a new collection.
Most of these signals are not in Shopify’s standard events, so you publish them yourself as custom pixel events. The guide to measuring the conversion cost of sizing uncertainty includes the code for a size guide event, and the same pattern works for the rest.
| Signal | How to capture it | What it can mean | Why it can mislead |
|---|---|---|---|
| Size switching | Custom event on size change | The shopper is between sizes | Shoppers also flip sizes to check stock |
| Size guide opens | Custom event on open | The page left size unanswered | Interested shoppers open it more, whatever the page says |
| Gallery loops | Custom event on image change, counting returns to the same image | A detail the photos do not settle: color, length, sheerness | A beautiful gallery also gets browsed for pleasure |
| Returning to reviews | Event when the reviews section comes into view, counted per session | Looking for fit or quality reassurance | Reviews can simply be entertaining |
| Color flipping | Custom event on color change | Unsure which color, or doubting the true shade | Also normal for shoppers choosing between colors they like |
| Add, then remove | Standard product_removed_from_cart event | Second thoughts on size, price, or total cost | Also cart tidying before checkout |
| Rage and dead clicks | A session recording tool | A control that did not respond | This is friction, not doubt: fix it first |
| Long dwell, then exit | Engagement time plus exit page | An unresolved question | Distraction and background tabs look the same |
For the recording signals, Microsoft Clarity’s definitions are a useful standard: a rage click is a burst of rapid clicks clustered in one spot, and a dead click is a click that produces no visible response. Clarity also flags excessive scrolling, meaning more vertical scrolling than expected, which on a product page often means a shopper hunting for information that is not where they looked.
Add the evaluation events into one count, evaluation events per product view session, but keep the parts visible. A SKU with a high count driven by size switching needs a different fix from one driven by gallery loops.
Pair events with qualitative evidence
An event tells you that something happened. It cannot tell you why. Before acting on any hesitation signal, find at least one qualitative source that agrees with it.
- Session recordings, filtered to the signal. Watch 10 to 20 recordings of non-buying sessions with high evaluation counts on the same SKU. Write down the last thing each shopper looked at before leaving. The patterns that repeat are the ones worth acting on.
- Customer questions. Support tickets, chat transcripts, and product Q&A for the SKU. If size switching is high and support keeps hearing “does this run small?”, the two sources agree.
- Reviews. Search the SKU’s reviews for fit, color, and fabric words. “Runs small in the bust” next to high size switching on a wrap dress is about as clear as evidence gets.
- A one-question poll. After a meaningful dwell on a product page, ask “What’s stopping you from adding this to your bag today?” with a few options and a free-text box. Keep it to that one question.
- A small moderated test. Sit with a handful of shoppers who resemble your customers, give each a realistic task (“find a dress for a June wedding and choose your size”), and ask them to think aloud. You will see the pause, and you will hear what caused it.
When the event and the qualitative source disagree, trust neither yet. High gallery loops with reviews full of praise may mean the photos are simply good. Look for a third source before you change the page.
This pairing is also the check on your own assumptions. Engagement on a product page predicts quality only when you know what kind of engagement it is, which is the argument in why product page engagement predicts conversion quality.
Segment by SKU
Hesitation averaged across a catalog is close to useless. A store with one problem dress and forty healthy products has a low average and one expensive leak.
Rank SKUs within the same product type and price band, so a $40 tee is not compared with a $400 coat, which deserves more consideration. Set a minimum number of product view sessions before you rank a SKU, and read mobile and desktop separately, because a gallery loop on a phone is a swipe and on a laptop is a click.
A simple worksheet keeps the evidence together. The rows below are illustrative:
| SKU (illustrative) | View-to-cart vs its type | Main evaluation signal | Qualitative evidence | Action |
|---|---|---|---|---|
| Green wrap dress | Well below | Size switching | Reviews: “runs small in the bust” | Bust measurement per size and a fit note |
| Wide-leg linen trousers | Slightly below | Gallery loops on the fabric image | Questions about sheerness | Daylight photo and a lining note |
| Cropped wool jacket | Below | Long dwell, then exit | Poll: “not sure it suits my shape” | Styled images on different bodies |
| Cotton crew tee | Above | Low | Nothing notable | Leave it alone |
The jacket row is where fit information runs out. That shopper’s question is how the cut will look on them, which no measurement answers, and the guide to silhouette fit uncertainty covers why cuts like that are hard to judge from studio photos.
A visual preview is one thing to test for rows like that. Some Antla merchants have seen returns fall by up to 30% after adding try-on, compared with their own return rate on the same stores before they added it. Treat that as the top of a range across stores rather than an expected result, since it varies by store and category. Antla merchant reporting, cohort dates not published.
To check it on your own store, compare the SKUs you enable with similar SKUs you leave alone, over the same weeks and with the same return reason groups. Because try-on speaks to looks rather than fit, check which return reasons moved instead of assuming fit improved. Antla is one way to add try-on to Shopify product pages for that comparison.
Avoid misreading long sessions
Session length is the metric most likely to fool a fashion team. A long session can be a shopper absorbed in a collection or a shopper stuck on one question, and the number looks identical.
Five habits keep it honest:
- Use engagement time, not wall-clock time. In GA4, user engagement is time with the page in focus or the app in the foreground, so a tab left open behind a video call does not count as interest.
- Know when sessions end. In Shopify’s reports, a session ends after 30 minutes of inactivity (Shopify session measurement), so a shopper who wanders off and comes back an hour later starts a new session. One hesitant shopper can look like two short visits.
- Read distributions, not averages. A handful of very long sessions can drag the average up on their own. Use the median, plus the share of sessions above a threshold you choose.
- Measure density. Evaluation events per minute of engaged time separates a shopper who reads calmly from one who flips sizes six times in two minutes.
- Split by outcome. Long sessions that end in a cart are evaluation that worked. Long sessions that end in an exit are the ones to study.
Do not set a goal to raise time on page. A change that shortens sessions and raises carts is a win, because it answered the question sooner. The same caution runs through the guide on keeping shoppers on a fashion site longer: longer only counts when the time does work.
What hesitation metrics cannot do
- They cannot see declined shoppers. Analytics and recordings usually cover only shoppers who consented, and the ones who declined may behave differently.
- Recordings can be samples. Some recording tools capture a share of sessions rather than all of them, so check how yours samples before drawing conclusions from a small set.
- Custom events are fragile. A theme update or a new app can quietly stop an event from firing. Check the counts after every change to the product page.
- Hesitation is not always bad. An expensive coat deserves more deliberation than a basic tee. Compare each SKU with others of its own type.
- Correlation is not a cause. A SKU with high hesitation may also be new, pricier, or badly photographed. Qualitative evidence narrows it down, and a test settles it.
When the SKU evidence points to page-level problems rather than garment-level doubt, the view-to-cart diagnosis by device and source is the better starting point.
Instrument three events this week
Add custom events for size changes, size guide opens, and gallery image changes. After two weeks, rank the SKUs in one product type by evaluation events per view session, then watch ten recordings of non-buying sessions on the top SKU. Write one sentence about what those shoppers were unsure of, find a second source that agrees, and only then change the page.
About the author: Aaron founded Antla and has watched enough session recordings to recognize the specific pause before someone opens a size guide.