

Why Paid Social Traffic Bounces on Fashion Sites
Paid social visitors leave fashion landing pages when the page breaks the ad's promise or loads slowly in-app. How to check it, compare cohorts, and test fixes.

Paid social shoppers bounce from clothing landing pages when the page breaks the ad’s promise, loads slowly inside an in-app browser, or asks for effort before showing the product they tapped. Check that the first screen matches the ad, audit mobile loading, compare campaign traffic against a control cohort, and test an earlier interaction such as swatches or a size picker near the top.
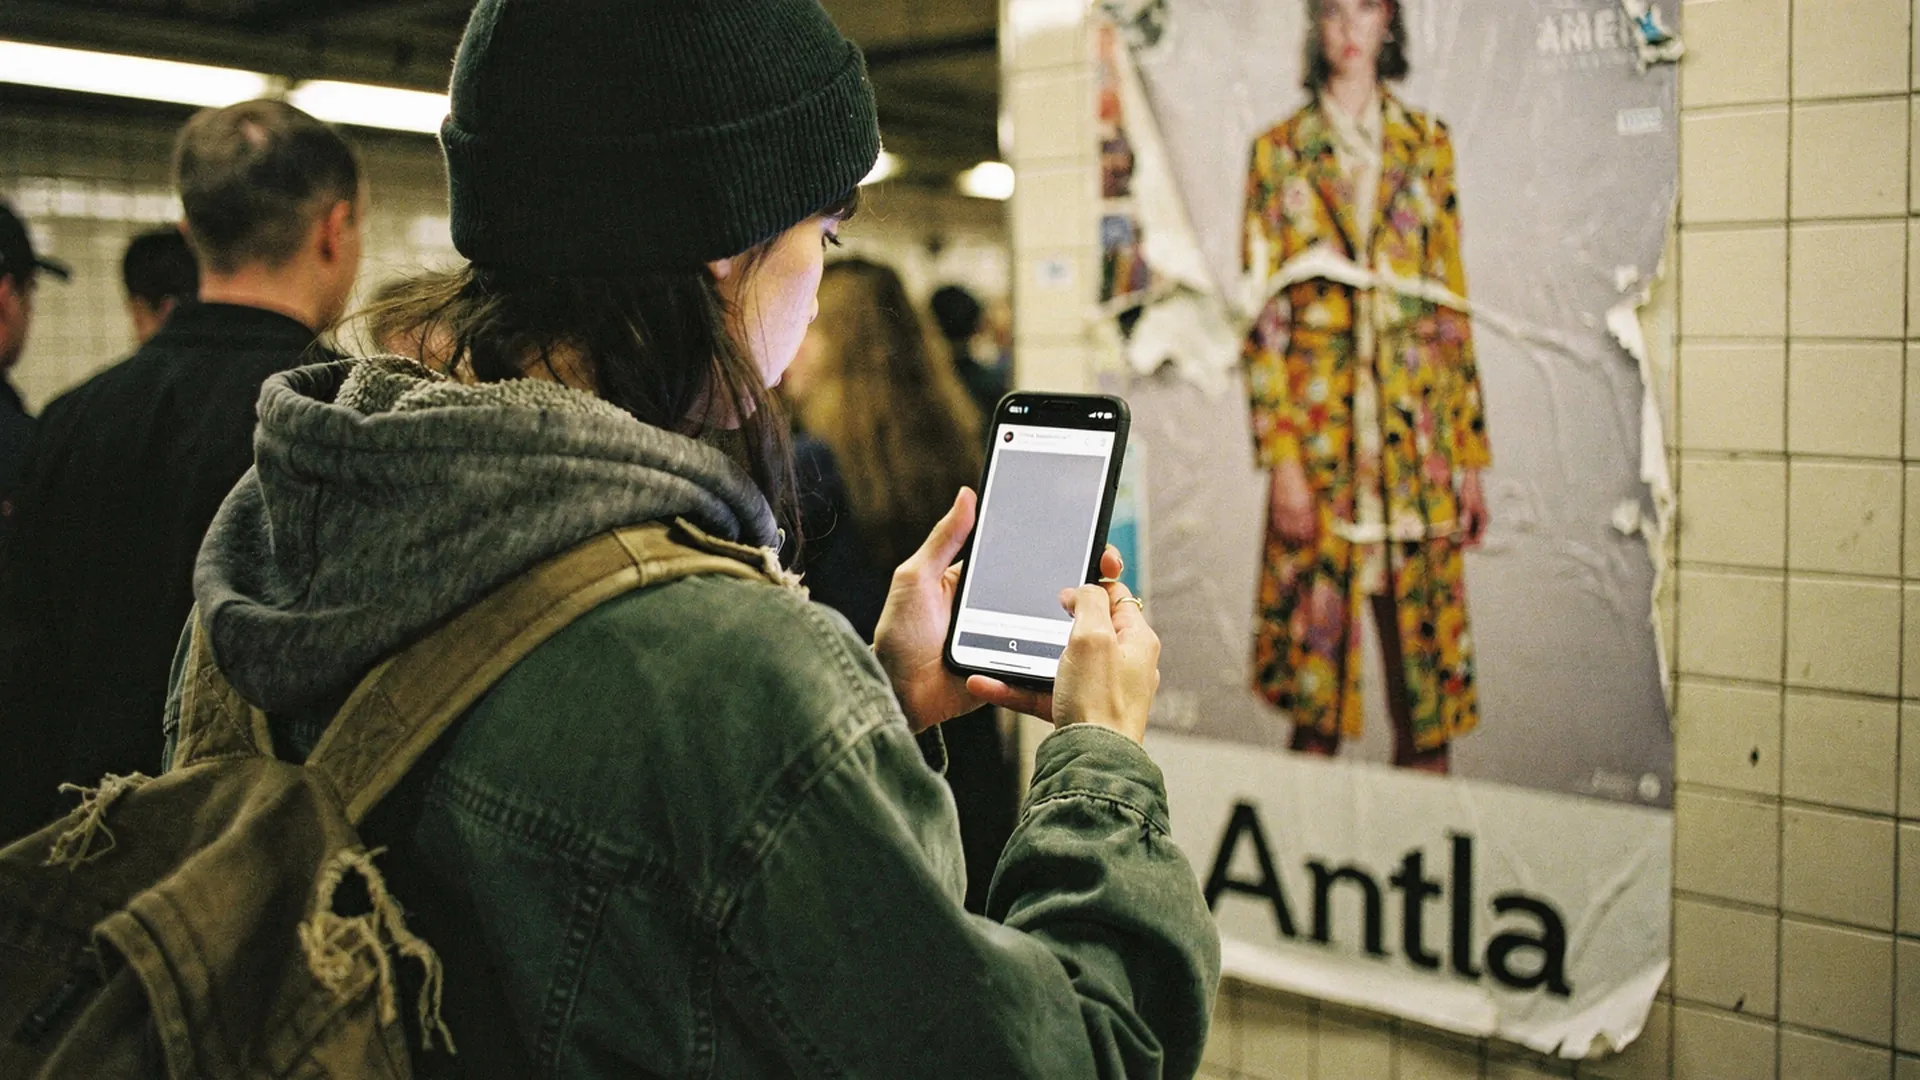
The ad did its job. The page is still loading. Editorial image in Classic Antla disposable-camera style.
A shopper on a train platform taps an ad for a rust-colored coat. The page opens inside the social app’s own browser, over mobile data, and it has a few seconds to show the same coat at the same price before the thumb goes back to the feed.
When paid social traffic bounces, the cause is usually one of three things: the page does not match the ad, the page is slow in that environment, or the page makes the shopper work before it shows them anything. Here is how to tell which one you have, and what to test.
Check ad to page promise
Every ad makes a promise: a specific piece, a color, a price, an offer, or a look. The first screen of the landing page has to keep it, on a phone, without a scroll. A shopper who tapped that rust-colored coat and lands on a grid of twenty coats has to start shopping all over again.
| What the ad promised | How the page often breaks it | What to check |
|---|---|---|
| One piece in one color | Lands on a collection, or on the product in its default color | The advertised color is already selected when the page opens |
| A price or a discount | The offer appears only at checkout, or excludes some sizes | The offer and its terms are visible on the first screen |
| A styled look | Lands on one piece with no way to reach the others | A shop-the-look page, or the other pieces linked from the product |
| A new drop | Core sizes already sold out | Stock in the sizes your audience buys, checked before spend goes up |
| A creator wearing the piece | Studio photos only, on a different body | An image close to the ad in the first gallery position |
The quickest check costs nothing. Open the ad on your own phone, inside the app, and screenshot the first screen of the landing page. Put the two images side by side. If someone who has never heard of your brand cannot match them at a glance, the promise is broken, and no speed fix will rescue that click.
If the product pages themselves need work before they can carry paid traffic, the guide to fashion product pages that convert before you run ads covers the media order and fit language to fix first.
Audit mobile loading
If the page matches the ad and shoppers still leave, check whether they ever saw it.
In Meta Ads Manager, compare link clicks with landing page views. Meta counts a landing page view when your page loads after someone clicks the ad, and suggests comparing the two to see how many people clicked but left before the site loaded. Landing page views are tracked through Meta’s in-app browser or the Meta Pixel.
A wide gap on one ad, but not on others that send traffic to the same site, points at that ad’s landing page. A wide gap everywhere points at the site, or at the pixel.
Remember where that page opens. Social apps usually open links in their own in-app browser, where the shopper is rarely logged in to your store and has little or nothing from your site cached. That is the least forgiving version of your store, and it is the one most of your paid social traffic sees.
For the numbers, use Core Web Vitals. Google’s thresholds for a good experience are a Largest Contentful Paint within 2.5 seconds, an Interaction to Next Paint of 200 milliseconds or less, and a Cumulative Layout Shift of 0.1 or less, measured at the 75th percentile of page loads and split by mobile and desktop. Shopify’s web performance reports show the same three metrics from real user data over the past 30 days, rate each one Good, Moderate, or Poor, and can be filtered by device type. Filter to mobile and look at product pages first, since that is where most fashion ads land.
The usual culprits on a fashion product page:
- A huge first image. Full-resolution shoot files served to a phone on mobile data.
- Autoplay video above the product. It pushes the piece down the screen and competes for bandwidth.
- Too many apps on the product page. Reviews, upsells, chat, and popups each add scripts. Remove one, then measure again.
- A popup over the product. An email-capture popup covering the piece the shopper just tapped is a bounce you designed. Delay it, or hide it for paid social sessions.
- Late-loading blocks near the buttons. A banner or review widget that loads late and pushes the size selector down causes mis-taps. Cumulative Layout Shift measures exactly this.
- A cookie banner that fills the screen. Where you need consent, design the banner so the product and the add-to-cart button stay visible behind it.
Compare campaign and control cohorts
A bounce rate on its own cannot tell you whether the problem is the page or the people. A comparison can.
First, know what bounce means in the tool you are reading. In GA4, a bounce is a session that was not engaged, and a session counts as engaged if it lasts longer than 10 seconds, has a key event, or has at least two page views (GA4 engagement rate and bounce rate). Other tools, including Shopify’s own reports, may define bounce differently, so never compare a bounce rate from one tool with a bounce rate from another.
Then build a control. The cleanest control for a paid social campaign is other traffic to the same landing page, on the same device type, over the same dates: organic social, email, or direct visitors. If a page works for your email subscribers on mobile and bounces for the campaign, look at the audience, the targeting, and the ad’s promise before you rebuild the page.
Two pieces of hygiene make the comparison fair. Filter out bot sessions first, because social platforms fetch pages to build link previews; the guide for stores with traffic but few sales shows where that filter lives in Shopify. And tag every ad with consistent UTM parameters (source, medium, campaign, and content for the creative) so you can split sessions by campaign and by ad. The same tagging discipline behind Instagram Stories that drive fashion website traffic applies to paid placements.
| Campaign vs control, same page and device | Probably | Next move |
|---|---|---|
| Campaign bounces far more, control is fine | Audience or ad promise | Revisit targeting and the creative-to-page match |
| Both bounce heavily on mobile | Speed or the first screen | Loading audit and a first-screen fix |
| Link clicks far above landing page views | Loading, or the pixel | Test the page inside the app, then check pixel setup |
| Campaign engages but rarely adds to cart | Doubt about the product | Earlier interaction, plus fit and price information |
If the campaign sessions engage but the drop happens later, at the cart or checkout, the method for mapping conversion leaks by landing page will locate it more precisely than bounce rate can.
Test earlier interaction
A paid social visitor has not decided anything yet. They saw a piece they liked and tapped. The page should give them something to do with that interest straight away, on the first screen, before a scroll.
Candidates worth testing, roughly from cheapest to most involved:
- Color swatches that change the main image. The fastest way to say “yes, that one.”
- A size picker near the top, with a one-line fit note beside it, so the shopper can check availability without scrolling.
- A styled image close to the ad creative in the first gallery slot, so the page looks like the ad that earned the tap.
- A short clip of the piece moving, if it loads quickly on mobile data.
- A preview of the piece on the shopper, for items where the doubt is how it will look.
Measure the share of campaign sessions that interact with the product on the first screen, then cart additions and orders for the same sessions. An interaction that lifts engagement without moving carts is decoration. Split-test against the current page while the same ads run, so both versions get identical traffic.
On the preview option: Antla’s try-on data, drawn from more than half a million try-ons, puts the conversion rate for shoppers who used the feature at 3.8%. That rate belongs to a group that chose to engage, so it is not a store-wide figure, a forecast for your paid social traffic, or a benchmark. Antla merchant reporting, cohort dates not published. Try-on helps a shopper see how a piece looks on them and says nothing about which size will fit.
If you want to test it as the earlier interaction, Antla is the Shopify app, and a split test against your current landing page is the only way to learn what it does for your campaigns.
What this analysis cannot settle
- Landing page views can be estimated. Meta notes that it may use statistical modeling when events cannot be counted directly, so treat small differences in the click-to-view gap as noise.
- Shopify’s speed data comes from Chrome users. Shopify collects its field data from Chrome users who opted in to sharing performance metrics (Shopify’s performance testing guide), so it is a guide to in-app sessions rather than a direct measurement. Test inside the apps yourself.
- Consent gaps. Shoppers who decline tracking may be missing from analytics and ad reports, and the missing share differs by market.
- Attribution rules differ. Ad platforms and your analytics tool count conversions under different rules, so a campaign can look better in one and worse in the other. Compare trends within each tool, not totals across them.
- Small campaigns are noisy. A few hundred clicks cannot separate a real bounce problem from a slow week.
Tap your own best ad today
Take your highest-spending paid social ad. Open it inside the app, on your phone, over mobile data, and screenshot the first screen. Compare its link clicks with landing page views for the last two weeks, and pull engagement for that landing page by source and device.
Fix the worst of the three problems first, then split-test one earlier interaction on the first screen. Every fix here makes the budget you already spend go further, which is the case made in selling more with the same ads budget.
About the author: Aaron founded Antla and thinks every media buyer should tap their own ads on a slow connection once a week.