

Shopify Plus Conversion Engine
High-traffic Shopify Plus stores need more than a PDP widget. How a conversion engine uses try-on-user conversion against typical Plus averages without overclaiming.

The Shopify Plus dashboard shows plenty of traffic and a conversion rate that refuses to be impressed. A new PDP widget goes live, engagement ticks up, and the weekly meeting still cannot answer whether the people who used it bought anything. At scale, an unanswered measurement question becomes an expensive habit.
Plus stores do not need another isolated interaction. They need a system that recognizes a product decision, helps the shopper complete it, and retains the intent when she leaves.
A Shopify Plus conversion engine connects an on-site decision tool, such as virtual try-on, to purchase outcomes and recovery channels. Antla data shows 3.8% conversion among try-on users, compared with a typical Plus store-wide reference around 2.1%. Those are different cohorts, so the comparison signals opportunity rather than proving store-wide lift.
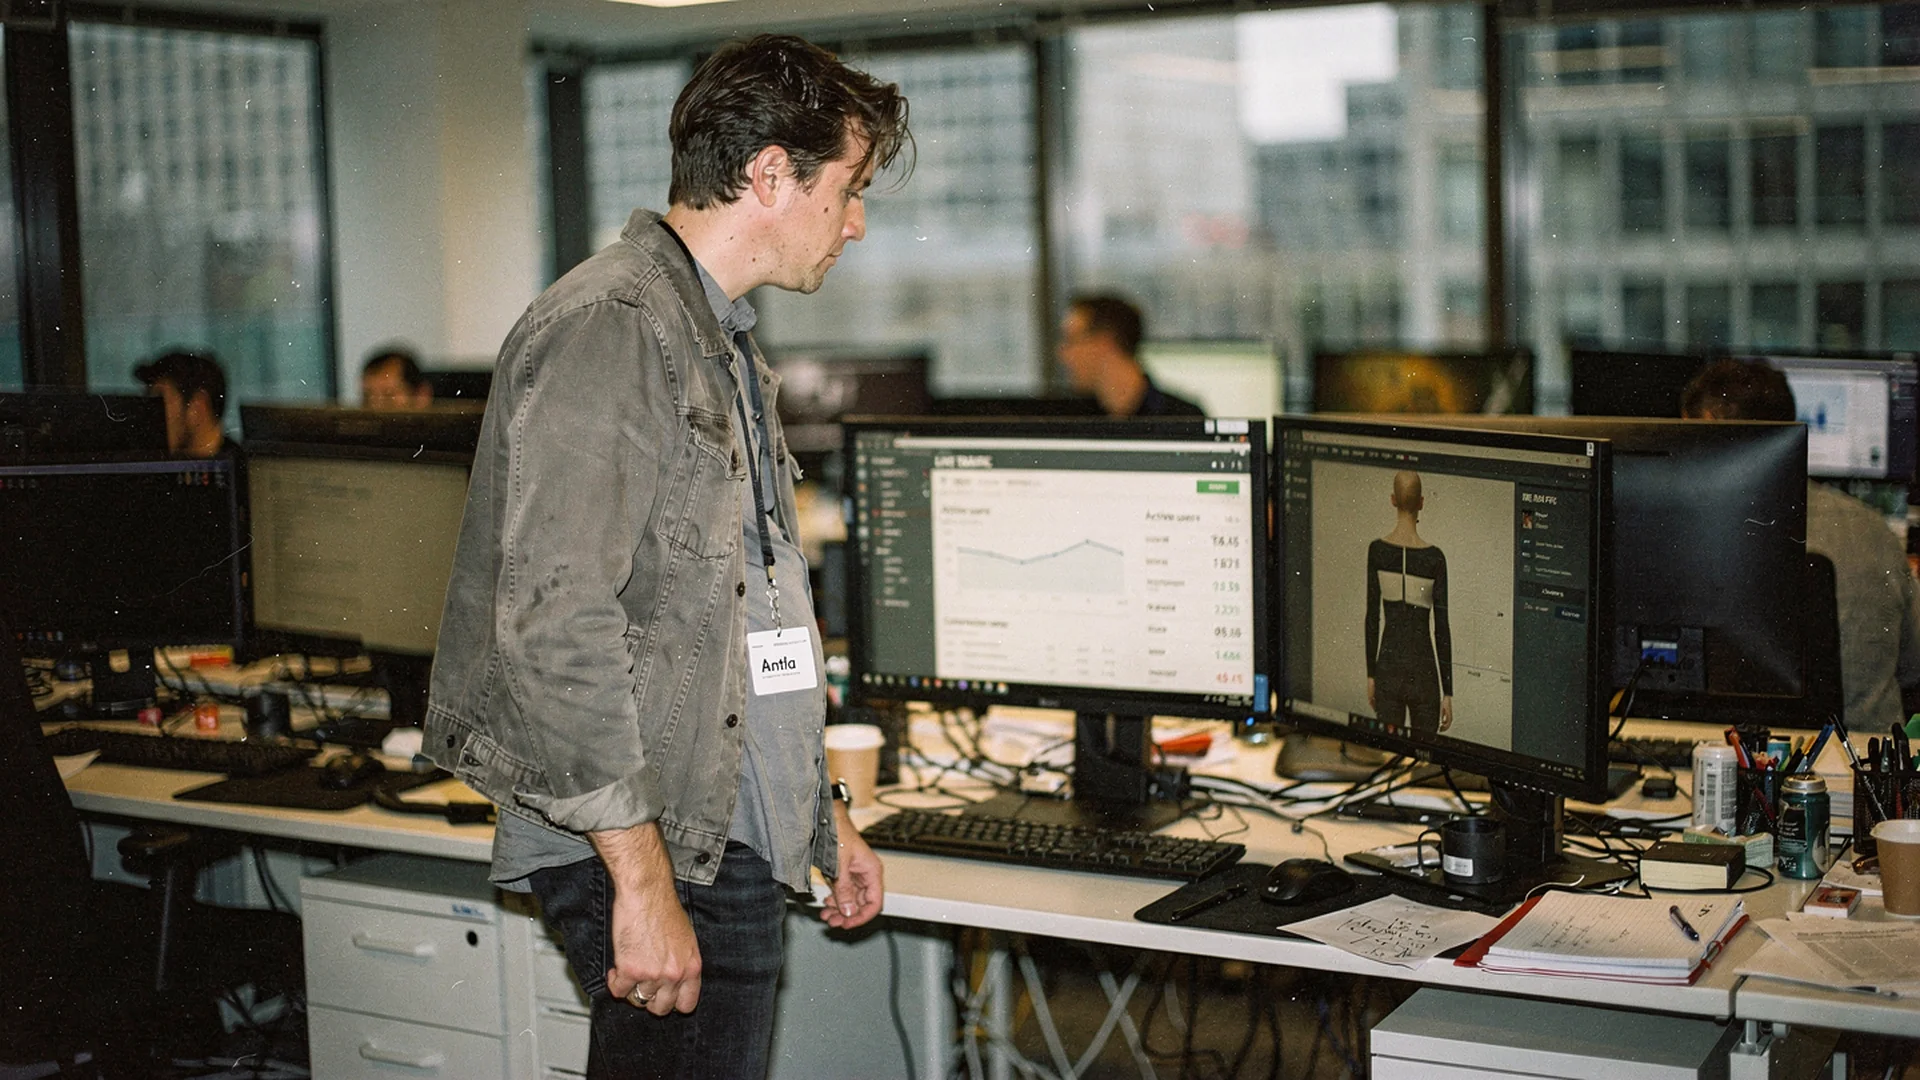
The useful path runs from product-page uncertainty to a measurable order or a recoverable product decision. Editorial image in Classic Antla disposable-camera style.
Plus traffic makes small leaks worth fixing
A fashion store with 500,000 monthly sessions has a different operating problem from one still proving demand. A weak product-page step does not fail quietly. It repeats across devices, collections, campaigns, markets, and thousands of shoppers who have already been paid for.
Traffic also makes generic optimization less informative. Store-wide conversion can move because a promotion launched, mobile traffic grew, a hero SKU sold out, or paid acquisition found a colder audience. The Plus operator needs to isolate the behavior being changed.
Shopify’s conversion-rate guidance treats benchmarks as rough references because category, price, device, traffic source, geography, and purchase frequency alter the result. A typical Plus reference near 2.1% can help frame performance. It cannot diagnose why shoppers abandon a structured jacket after studying the shoulder line, or why a dress sells on desktop but stalls on mobile.
That diagnosis starts closer to the decision. Did the shopper open the try-on, complete a preview, choose another color, add the product, and purchase within the agreed window? If not, did the engine preserve enough product context to continue the conversation later?
High volume gives the team enough observations to answer those questions. It also removes a common excuse for reporting every interaction as one blended average.
A Plus conversion engine is more than a PDP widget
A widget can generate a preview. An engine gives the preview a commercial route.
The full operating path has five connected parts:
| Engine part | What it does | What the Plus team should retain |
|---|---|---|
| Eligibility | Decides which products, markets, and sessions can use try-on | Product, variant, market, device, experiment state |
| On-site decision | Shows the shopper how the selected garment could look on her | Start, completion, generation result, selected variant |
| Outcome join | Connects the try-on user to an order or non-buyer state | Customer or session key, order lines, attribution window |
| Recovery route | Sends unresolved intent to permitted destinations | Product context, consent, channel, purchase suppression |
| Measurement | Compares cohorts and locates the leak | Reach, completion, conversion, recovered revenue, guardrails |
This is the practical version of what a conversion engine is: an on-site conversion layer connected to a recovery layer. The connection matters more than the number of tools in the stack.
A reviews app, popup, recommendation block, and testing platform may each improve a page. They do not become a conversion engine merely by sharing a Shopify invoice folder. The distinction from adjacent tools is laid out in conversion engine versus CRO and personalization. CRO tests page changes. Personalization chooses experiences from available context. The engine carries a specific intent event through an immediate outcome and, when needed, a second attempt.
For fashion, virtual try-on supplies unusually rich intent. A shopper did more than load a PDP. She evaluated the actual blazer, neckline, sleeve shape, drape, or color on herself. Shopify’s virtual fitting-room overview frames this technology around reducing the uncertainty left by online product evaluation. That makes the completed preview useful both as an intervention and as a behavioral signal.
Read 3.8% and 2.1% without combining denominators
Across more than 500,000 Antla try-ons, 3.8% of users who completed a preview converted. A commonly used Shopify Plus planning reference is roughly 2.1%. The first is a try-on-user conversion rate. The second is a store-wide conversion rate.
| Number | Denominator | Defensible interpretation |
|---|---|---|
| 3.8% | Users who completed an Antla try-on | Observed purchase rate for a high-intent interaction cohort |
| About 2.1% | All eligible sessions at a typical Plus store | Directional store-wide reference, sensitive to merchant mix |
The 3.8% cohort rate is about 1.8 times the 2.1% reference. That arithmetic does not mean installing virtual try-on will make the store convert at 3.8%. It does not prove a 1.7 percentage-point incremental gain, either.
People who choose try-on may arrive with more intent than people who leave after one product image. Product mix matters. So do placement, generation quality, device, traffic source, customer status, and the purchase window. A clean Plus analysis compares like with like and uses a controlled rollout where traffic permits.
It is equally important not to claim that 3.8% beats top-decile Shopify Plus performance. The useful statement is narrower: Antla try-on users convert above a typical Plus store-wide reference, and the cohort is commercially important enough to measure separately.
The Shopify virtual try-on conversion analysis goes deeper on the 3.8% result, selection effects, and the difference between relative and absolute lift. Keep those caveats in the board slide. A benchmark becomes less useful each time somebody removes its denominator to make the font larger.
Build the first rollout around an operator question
Start with a question that can change a decision. “Did shoppers engage?” is too soft. “Did completed try-on users buy the eligible product at a higher rate than comparable non-users?” gives the team a cohort, an outcome, and a reason to investigate.
I would build the first Plus rollout in this order:
- Choose a readable product set. Start with high-traffic items where appearance uncertainty is plausible, such as occasion dresses, unfamiliar cuts, statement outerwear, or products whose drape changes materially by body shape. Avoid mixing half the catalog into a launch merely to make the install look comprehensive.
- Protect the existing buy path. Place try-on near product media and buying controls without covering size selection, accelerated checkout, or sticky add-to-cart on mobile. Generation should preserve the selected color and return the shopper to the same product state.
- Write an event contract. Define eligible PDP view, try-on start, successful completion, product added, checkout started, and order completed. Include product and variant IDs, session or customer key, timestamp, market, device, and experiment assignment.
- Join orders at line-item level. A shopper may try on one dress and buy another. Decide whether the analysis counts exact-product purchase, same-collection purchase, or any order. Report those outcomes separately.
- Route non-buyers carefully. Where identity and consent allow, carry the product decision into email, opted-in SMS, ads, or a restored on-site state. Suppress immediately when the relevant purchase occurs.
Shopify’s ecommerce optimization guide recommends improving the complete journey rather than treating conversion as one page element. That is particularly relevant on Plus. Virtual try-on will not repair slow mobile rendering, unavailable sizes, vague duties, or a surprise shipping fee. The engine should expose those downstream losses, not absorb the blame for them.
Put the engine on the weekly trading report
The first dashboard should follow the sequence rather than decorate the result. Track eligible PDP sessions, try-on starts, successful completions, try-on-user purchases, and unresolved try-on users. Then add recovery eligibility, delivered treatment, suppressed purchasers, recovered orders, and net revenue.
Break the sequence down by:
- device and storefront market
- new versus returning customer
- collection, product, and variant
- acquisition source
- generation speed and completion state
- exact-product versus any-order purchase
This makes failures operational. Low reach points to placement or eligibility. Starts without completions suggest upload, speed, or generation friction. Healthy completion with weak exact-product conversion may reveal price, stock, sizing, or an unflattering product result. Good cohort conversion with little store-wide movement usually means reach is still small.
Recovery needs its own test. Hold back a comparable share of eligible non-buyers from treatment, then compare net revenue per shopper. Otherwise email, SMS, and ads will each offer to take credit for the same returning order.
Use the companion guide to conversion engine metrics for Shopify fashion when deciding whether the weekly question calls for the 3.8% cohort rate, conversion lift, or ROI. One number cannot answer adoption, incrementality, and economics at once.
The Antla conversion engine connects the on-page try-on with the product-specific intent left by shoppers who do not buy. For a Plus operator, the value is not another dashboard. It is a clearer route from a fitting-room question to an order, plus a usable record when the answer takes another session.
Questions Shopify Plus teams ask
What is a good conversion rate for a Shopify Plus store?
Around 2.1% is a useful typical Shopify Plus store-wide reference, but a good rate depends on category, average order value, device mix, acquisition source, geography, and measurement rules. Compare the store with relevant peers, then diagnose product-level changes through stable internal cohorts rather than one universal target.
How should Plus stores use a conversion engine?
Use it to connect a meaningful on-site decision event to a purchase outcome and a controlled recovery path. Start with high-traffic products, instrument try-on completion and order joins, preserve product and variant context, suppress purchasers, and measure exposed shoppers against a comparable cohort or holdout.
Is 3.8% a store-wide Plus benchmark?
No. The 3.8% figure is the conversion rate among users who completed an Antla try-on across more than 500,000 try-ons. It sits above a typical Plus store-wide reference around 2.1%, but the denominators differ. It should not be used as a promised store-wide rate or a claim about top-decile Plus stores.
Make high traffic produce a clearer answer
A Plus store already has enough moving parts. The conversion engine should make one of them easier to read: a shopper considered this product, received a personal visual, then bought or left behind recoverable intent.
Start with one high-volume collection and one stable cohort definition. Keep the denominator attached to every conversion claim. When the event path is clean, add Antla to your Shopify store and turn the fitting-room question into a measured operating loop.
About the author: Aaron founded Antla for Plus fashion brands that already have traffic and still lose the fitting-room question on every product page.