

Shopify Virtual Try-On Conversion Rate (3.8%)
Does virtual try-on raise Shopify conversion? Antla try-on users convert at 3.8% across 500,000-plus try-ons. That is a cohort rate, not store-wide lift.

Yes. Completing a virtual try-on on Shopify is associated with a higher purchase rate than store-wide traffic, because the shopper has seen the garment on themselves. Across more than 500,000 Antla try-ons, those users convert at 3.8%. That is a try-on-user cohort rate, not store-wide lift.
Paid fashion traffic still dies in the same place. The shopper liked the ad, opened the dress, scrolled the gallery, and then had to invent how the neckline, length, and shoulder would sit on her own body. Store-wide conversion treats that hesitation the same as a bounce from a 404. It is not the same problem.
This page is for the operator who is about to paste a try-on number into a board slide. The job is to keep the denominator honest, sit the 3.8% next to public Shopify averages without turning it into a lift claim, and give you a measurement plan you can run on your own catalog.
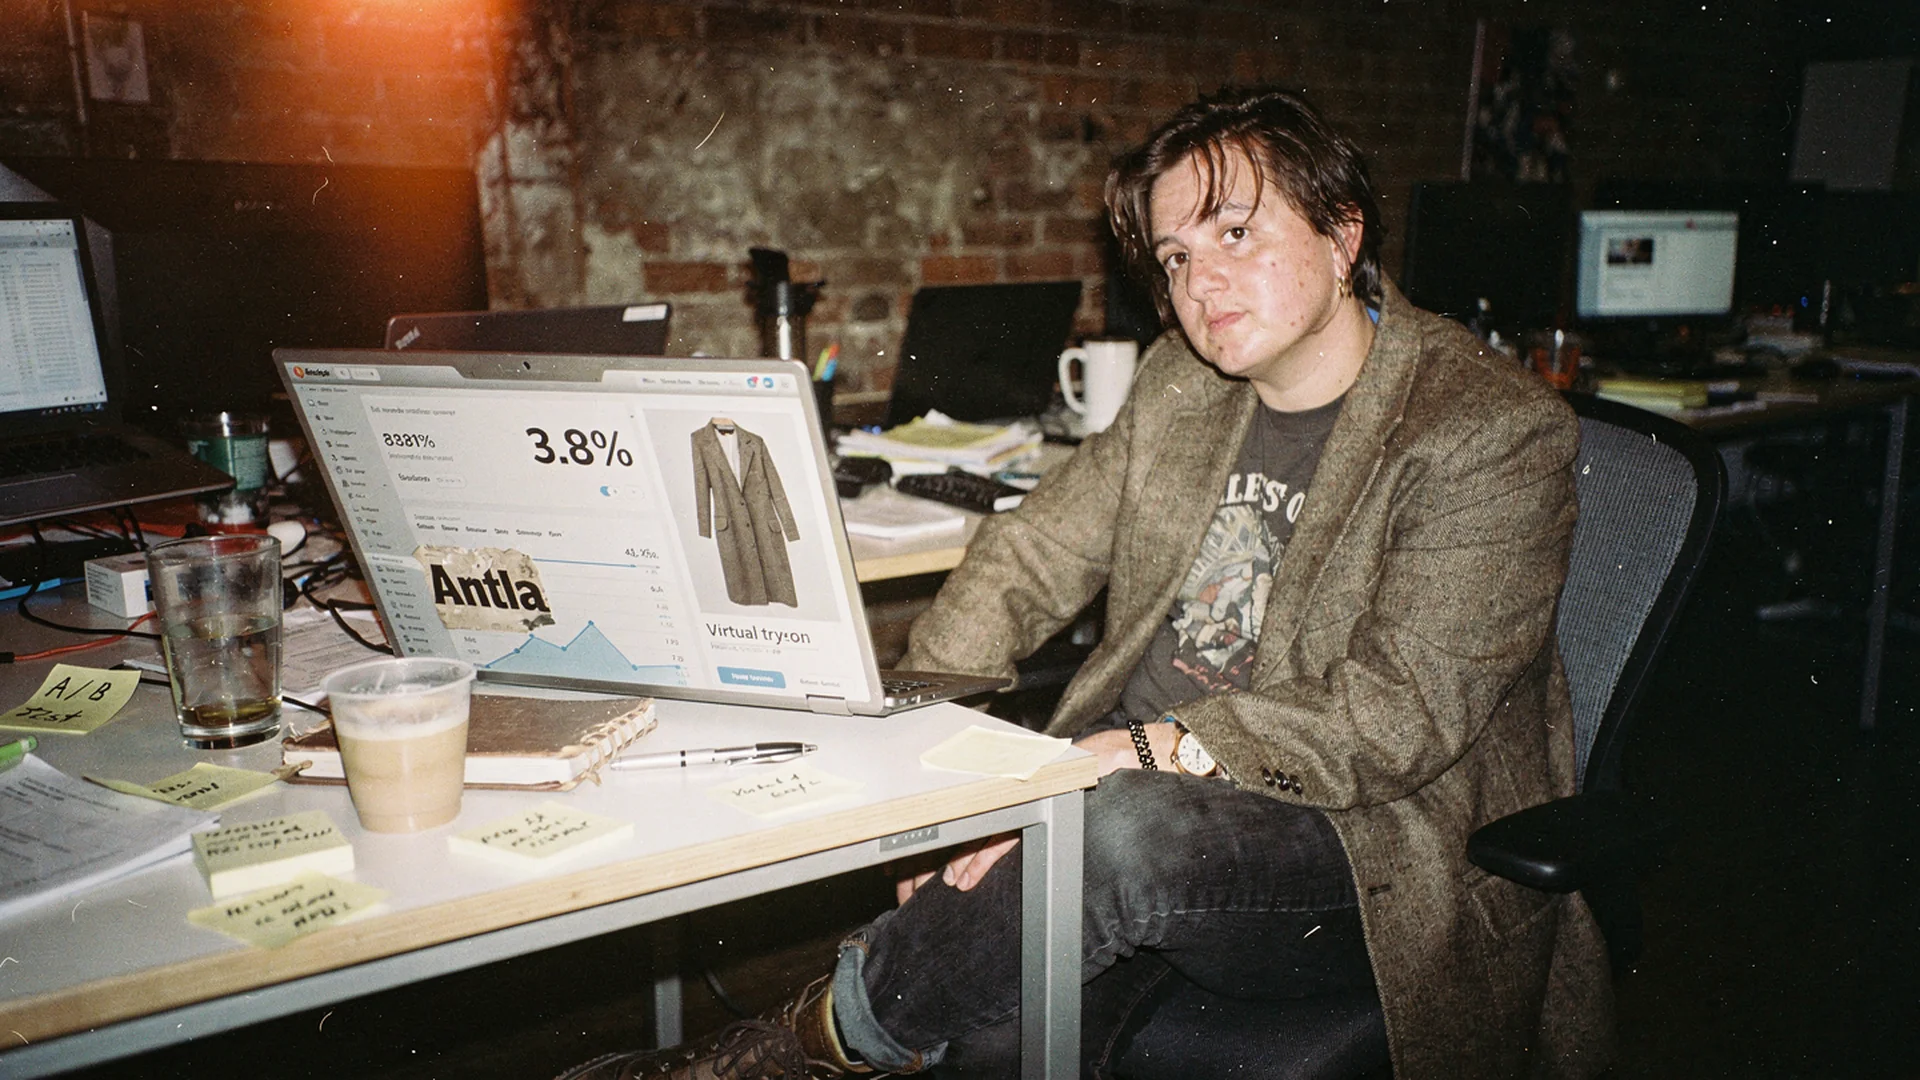
One report is every session. The other is only shoppers who finished a try-on. Mixing those rows is how a useful cohort becomes a fake store-wide win.
Store-wide conversion cannot see the “on me” stall
Shopify’s conversion-rate guide (updated 22 August 2026) is blunt about the metric: orders divided by visits, with visits counted as sessions, not users. It also warns that a single average is a weak target. Category, price, device, and traffic source move the number more than a button test will.
Fashion sits in the awkward middle of that spread. Shopify’s June 2026 industry table puts fashion, accessories & apparel at 2.77%. The same page cites Statista at 1.4% of global ecommerce visits converting in Q1 2026. Those are store-wide, all-session figures. They include people who never opened a product, people who opened ten products, and people who already knew the brand.
Shopify’s optimization playbook tells merchants to unbundle the rate: product-page views, add to cart, checkout reached, checkout completed. Apparel usually leaks between product view and add to cart. The gallery did its job. The size selector is still waiting. The shopper still cannot picture the piece on her.
That leak is why a try-on cohort exists at all. Someone who uploads a photo is past casual browsing. You should still not treat her purchase rate as the new homepage conversion.
What the 3.8% actually counts
The only Antla conversion figure this page uses is the one already published on this URL.
Across more than 500,000 completed try-ons, shoppers who finished a preview converted at 3.8%. In plain units: 38 orders per 1,000 people who generated a look. The numerator is purchases from that group. The denominator is users who completed a try-on. It is not sessions, not product-page views, and not every visitor to a store running the app.
Read it as a high-intent slice. Do not read it as “the store now converts at 3.8%.” Store count, date range, and attribution window have not been published next to the figure. There is no public holdout. People who choose to try something on often arrived with more intent than people who bounce after one flat lay, so the gap is an association, not a causal lift you can paste into a paid-media forecast.
The useful claim is still real: at this scale, completers are a commercially interesting cohort. They deserve their own row in the weekly report. They do not get to overwrite the Shopify overview.
Sit 3.8% next to public Shopify averages without doing fake math
Littledata’s Shopify conversion benchmark, generated 7 October 2026 from 426 stores over 6 July to 3 October 2026, puts the median store at 1.4% of sessions with a purchase. Fashion and apparel in that set sit at a 1.3% median, with the top 20% of fashion stores at 2.2%. Across all industries, the top 20% clear 2.7% and the top 10% clear 3.5%.
| Benchmark | Rate | Denominator | Source, as of 7 October 2026 |
|---|---|---|---|
| Median Shopify store | 1.4% | Sessions with a purchase / all sessions | Littledata, 426 stores |
| Fashion and apparel median | 1.3% | Same method | Littledata |
| Top 10% of that Shopify set | 3.5%+ | Same method | Littledata |
| Fashion, accessories and apparel | 2.77% | Industry average, June 2026 | Shopify conversion-rate guide |
| Global ecommerce visits | 1.4% | Visits that purchased, Q1 2026 | Shopify citing Statista |
| Antla try-on users | 3.8% | Purchases / completed try-on users | This page |
Do not divide 3.8 by 1.4 and call it lift. Littledata and Shopify are measuring stores. 3.8% is measuring people who already finished a product interaction. A try-on cohort can sit above a typical store-wide average and still lose to a strong Plus store’s all-session rate. Shopify does not publish a Plus conversion average on the pages cited here, so this rewrite does not invent one.
If 2% of product-page visitors complete a try-on, even a 3.8% cohort barely shows in the blended number. If a much larger share completes it, placement and generation success start to move the overview. That reach figure is yours to measure. It is not published as an Antla metric.
Photos, charts, and reviews still leave one question open
Baymard’s apparel UX research (updated 25 February 2025) found that 90% of sites miss at least one core apparel-purchase practice. 82% fail to give enough sizing information. 21% skip human-model images or offer only one. Shoppers who cannot judge appearance, size, or fit abandon. That is conversion, not a merchandising preference.
A size chart answers the label. A model photo answers the studio. Reviews answer “true to size” in the aggregate. None of them answer how this wrap dress hits this torso. Shopify’s virtual fitting-room guide describes the commercial job as cutting uncertainty about fit and style before purchase. That is the conversion mechanism. It is not “more engagement.”
Antla is photo try-on on the product page. The shopper uploads a photo, sees the garment on herself, then keeps or drops the SKU. It has no size chart or size recommendation of its own. Keep the chart you already run. Try-on does not prove physical fit, stretch, or whether a 27-inch inseam will actually hit the shoe.
Photo handling, quoted from the privacy policy: “Images are deleted and not accessible within 72 hours.”
Measure try-on as a funnel step, not a mood
A conversion rate without the steps above it is a result you cannot fix. Borrow Shopify’s unbundle habit and apply it to the preview.
Track four numbers on the same SKUs, same window, same purchase definition:
- Start rate. Eligible product-page sessions that open try-on.
- Completion rate. Starts that produce a preview.
- Try-on-user conversion. Completers who purchase inside the window you already use for CRO.
- Contribution. Completers × their conversion rate, as a share of total orders. This is how you see whether the cohort is a footnote or a line of business.
Break each row by device, collection, and traffic source. Weak mobile completion is usually upload friction or a button buried under a sticky cart. Strong completions and weak purchasing on one blazer often means price, stock, or a preview that made the cut honest. Either finding is more useful than a single blended percentage.
Do not raise start rate by intercepting every visitor. Put the control next to the gallery and the size selector, say what the shopper will see, and let people who need the picture use it. Implementation without a developer fight is in how to add virtual try-on to Shopify. The virtual try-on feature is the product-page block that creates the cohort you can actually count.
Same-session orders and later recovered orders should not share one credit. If you capture email during try-on, send consented events into Klaviyo when that plan lists it. Do not treat everyone who loaded the PDP as a try-on non-buyer.
A seven-day test that answers the question on your catalog
You do not need a new attribution religion to see whether this is worth the line item. You need hero SKUs, a clean comparison group, and a trial long enough to collect completers.
Antla pricing on 7 October 2026:
- Every plan includes a 7-day free trial. There is no free plan.
- Trend, $19.99/month: 100 try-ons, then $0.16 each.
- Runway, $49.99/month: 500 try-ons, then $0.12 each.
- Unlimited Fashion, $199.99/month: 2,000 try-ons, then $0.09 each.
Run the trial on dresses, blazers, or anything whose gallery already gets time-on-page without add-to-cart. Compare completers with shoppers who viewed the same products and did not complete a try-on. Hold device and source as steady as the traffic allows. If volume is too thin for a holdout, say so in the write-up instead of inventing incrementality.
Finance will ask about returns. That is a different denominator. Use does virtual try-on reduce returns? for that question, and keep conversion and refunds in separate columns. Payback math against plan cost lives in virtual try-on pricing and ROI.
Antla is not SOC 2 or ISO certified. If compliance is the blocker, stop here rather than hoping a conversion slide covers it.
What I would put on the slide, and what I would cut
Keep: 3.8% among completed try-on users, across more than 500,000 try-ons, published on this page. Keep the caveat that it is not store-wide and not a holdout.
Cut: any sentence that turns that cohort into a store-wide conversion rate. Cut ratios that treat Littledata’s 1.4% as the control group for Antla. Cut claims this page does not have the data to make.
If the cohort on your store is valuable, raise reach and completion before you argue about the homepage rate. If it is not, you learned that on a trial instead of a six-month rollout. See a clothing try-on on a Shopify catalog at Antla.io/demo.
Merchant questions about Shopify try-on conversion
Does virtual try-on increase conversion on Shopify?
It is associated with a higher purchase rate among people who finish a preview, because they have resolved how the garment looks on them. Across more than 500,000 Antla try-ons, that cohort converts at 3.8%. Validate on your catalog with a consistent window. Shoppers who opt into try-on may already be closer to buying.
What is a typical virtual try-on conversion rate?
There is no universal rate across catalogs and placements. The published Antla observation is 3.8% among try-on users. Segment your own result by completion, device, product, and source. Do not compare a try-on-user rate with store-wide sessions as if they share a denominator.
Is 3.8% a store-wide Shopify conversion rate?
No. 3.8% is purchases divided by users who completed a try-on. Shopify and Littledata averages in the table above are session-based store rates. A store can convert at 1.3% overall while its try-on completers convert at 3.8%.
Does virtual try-on replace a size chart?
No. Try-on shows appearance on the shopper. It does not pick a size. Antla has no size chart or size recommendation of its own and sits beside any Shopify size app. Why size charts fail is a chart problem. The rest of the page is a PDP conversion problem.
How much does it cost to test virtual try-on on Shopify?
As of 7 October 2026, Antla plans start at $19.99/month after a 7-day free trial (Trend: 100 try-ons, then $0.16). Check antla.io/pricing on the day you buy.
Nearby conversion reading: Does virtual try-on work? · Shopify PDP conversion for fashion · Why size charts fail on Shopify fashion