

The Selection Bias in Virtual Try-On Conversion Claims
The 3.8% try-on-user rate describes shoppers who opted in. Compare them with a holdout of eligible shoppers before you treat that rate as the offer's effect now.

Shoppers who tap try-on were already more interested than shoppers who scrolled past. Their conversion rate describes that eager group. It does not describe what those shoppers would have done if the preview had never been offered. A holdout of eligible sessions is the comparison that can support a causal claim.
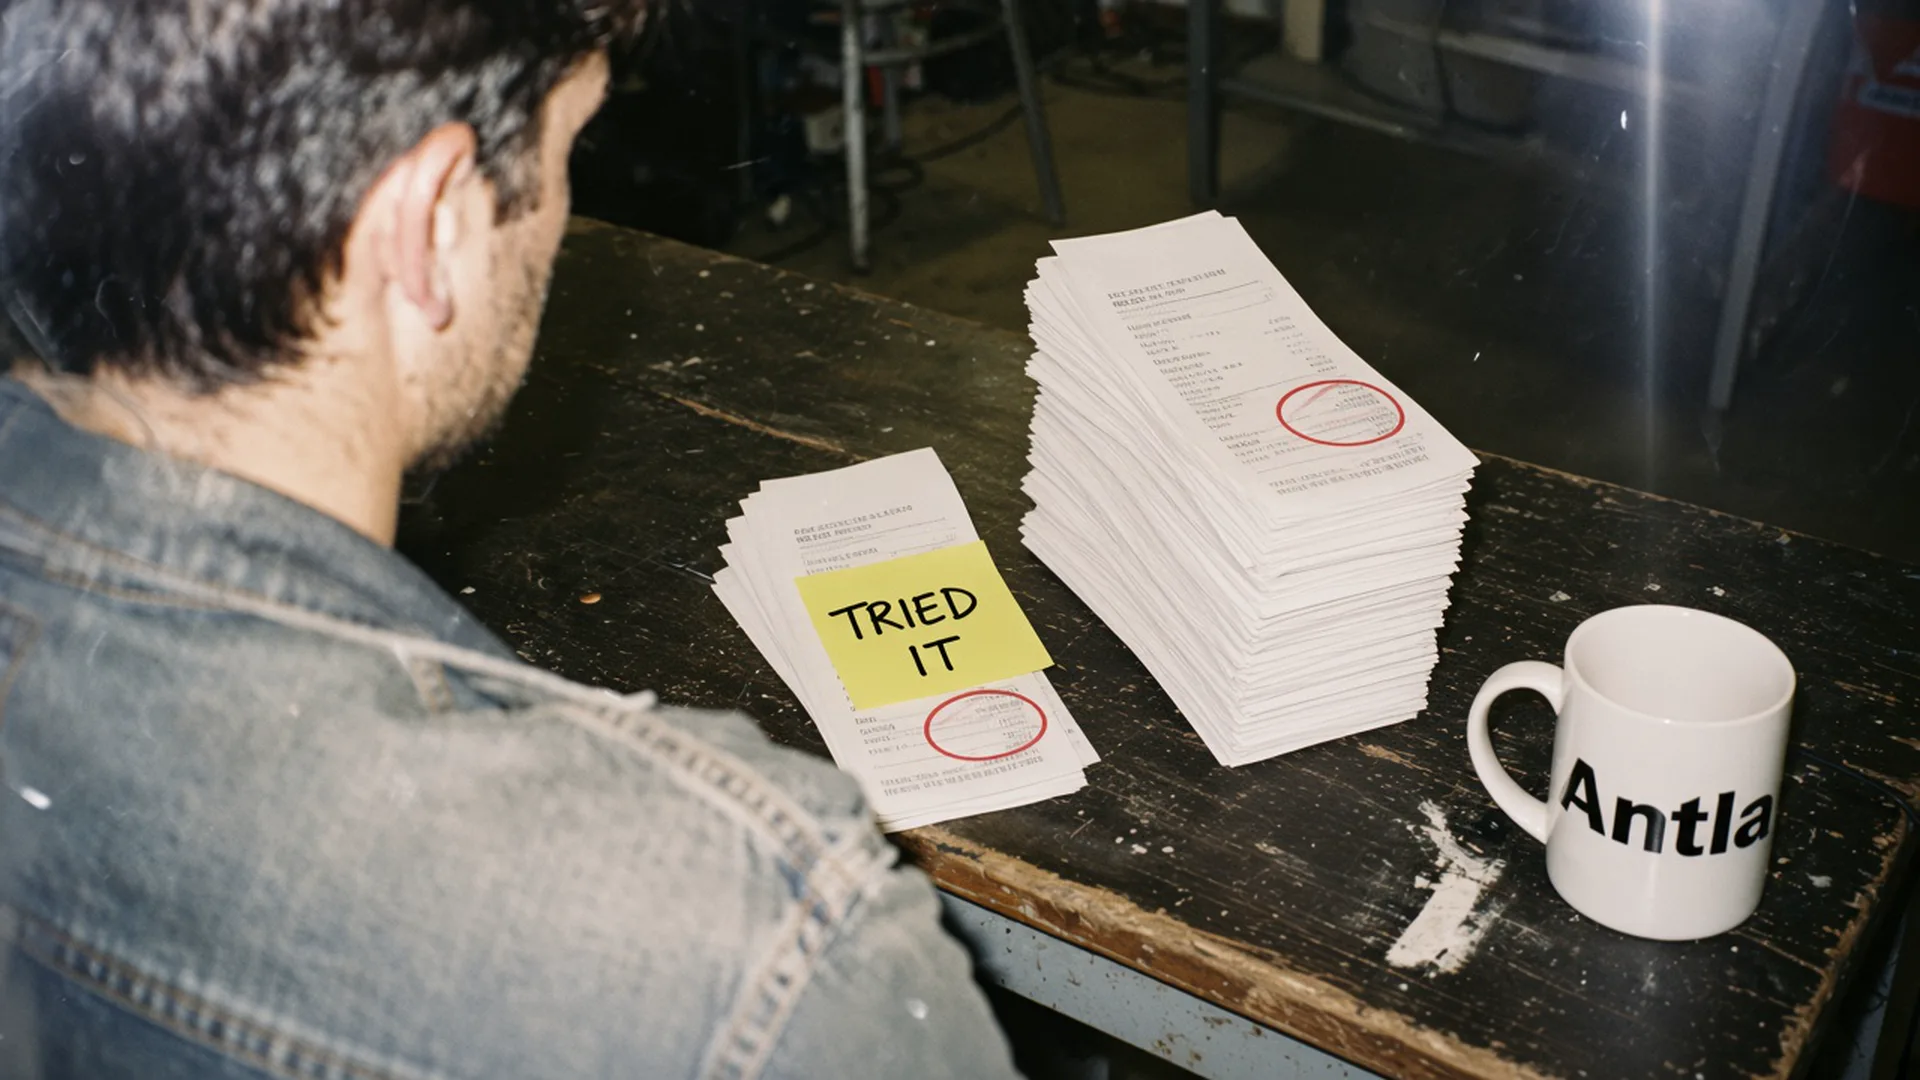
The small stack is everyone who tried the preview. The large stack is everyone who could have. Editorial image in Classic Antla disposable-camera style.
I have watched the 3.8% figure travel from a cohort note into a board slide labeled “conversion rate.” The arithmetic inside the figure is fine. The slide is the problem. People who complete a preview are a selected slice of traffic. Comparing their purchases with the whole store, or treating their rate as the effect of the tool, credits the tool for the shopper’s intent.
Shopify’s guide to conversion rates already warns that one benchmark mixes devices, prices, and sources. Selection bias is the version of that warning inside a single store: the people in the numerator chose to be there.
Explain self-selection
Self-selection means the shopper sorts herself before you measure her. On a product page the sort looks like this. A visitor lands, glances, and leaves. Another visitor opens the size guide, zooms the fabric, and taps the preview. The second visitor has announced that she is in a decision. The first has not. Any metric that keeps only the second visitor will look strong, including metrics that have nothing to do with the preview. If you measured “shoppers who zoomed the third photo,” many of them would convert at a high rate too. The zoom did not cause the purchase. The interest did.
Try-on adds a cost, which makes the sort sharper. Uploading a photo, waiting for a generation, and looking at the result takes effort. People who pay that cost are, on average, closer to buying than people who will not. That is useful information about intent. It is a bad control group for the tool, because the control (everyone else) includes people who were never going to buy the coat.
The behavior shows up in ordinary analytics. Shopify’s behavior reports move from sessions to cart to checkout. Shoppers who reach the later steps convert at higher rates than shoppers who only arrived. Nobody treats “reached checkout” as proof that the checkout button caused demand. Reached-preview deserves the same modesty.
A concrete picture, with made-up counts so the bias is easy to see:
| Group | Shoppers | Orders | Orders per 100 |
|---|---|---|---|
| Finished a preview | 1,000 | 38 | 3.8 |
| Saw the button, did not start | 9,000 | 90 | 1.0 |
| All shoppers who could see the button | 10,000 | 128 | 1.28 |
The 3.8 per 100 is real inside the first row. The store’s eligible rate is 1.28. Quoting 3.8 as the store rate multiplies the truth by about three, using only the eager row. None of these illustrative rows is an Antla benchmark. They exist so the selection is visible.
What Antla has published is the eager row at scale. Of shoppers who completed a try-on, 3.8% purchased, across more than 500,000 try-ons. The group is try-on users. There is no column beside it for eligible shoppers who were randomly denied the button. Antla merchant reporting, cohort dates not published. Quote it as a try-on-user conversion rate. The metrics guide uses that name for the same reason.
There is a second published association: try-on users converted 35% higher, on average, than shoppers who did not complete a try-on. The comparison group is those non-users. They opted out of the preview, or never started it. That is still self-selection. Antla merchant reporting, cohort dates not published. A 35% relative gap between volunteers and everyone else can be entirely the volunteers. It can also contain a real effect. The gap alone cannot say which.
Returns pick up the same pattern. Some merchants have seen returns as much as 30% lower than the return rate on a comparable set of orders where the shopper did not use try-on. The comparison group is that non-user order set, and the gap is an association. Antla merchant reporting, cohort dates not published. Shoppers who preview may also be shoppers who read the chart and order one size. The return line needs a holdout before it becomes a causal claim. Whether try-on lines up with fewer returns is the measurement question, not a slogan.
The preview still does one job well when the copy is honest: it shows appearance. Color, pattern, and a rough silhouette on the shopper’s photo. It does not measure the body, and a high conversion rate among people who liked the picture is not a fit guarantee.
Compare exposed cohorts
The fix for the denominator starts before anyone taps. Compare people who were offered the preview with people who were not, and include the non-tappers in the offered group.
Call the offered group the exposed cohort. It contains:
- Shoppers who finished a preview.
- Shoppers who started and abandoned the upload.
- Shoppers who saw the button and ignored it.
Call the other group the holdout cohort: eligible shoppers who got the ordinary product page. Same templates, same weeks, same traffic sources as far as random assignment allows.
The intent-to-treat comparison is exposed versus holdout, on orders per eligible shopper. It answers: what happens when we offer this? The try-on-user rate answers: what happens among people who already opted in? Both can be true. They are not substitutes. How to measure incrementality is the build sheet for the offer test.
If you cannot randomize yet, you can still stop the worst comparison. Put these side by side and refuse to rank them:
| Cohort | What it includes | Fair use |
|---|---|---|
| Try-on users | Only people who finished a preview | Describe the activity log |
| Exposed, including non-users | Everyone who could see the tool | The treated population |
| Holdout | Eligible shoppers with no tool | The control |
| All store sessions | Home, blog, account, everything | Store health, not the tool |
A chart that shows try-on users at 3.8% and the store at something lower is a picture of selection. Label it that way or delete it. Does virtual try-on work can stay a product question. The cohort labels decide whether the answer is evidence.
Device and source still split the exposed cohort. A mobile paid-social session and a desktop returning customer are different offers even when both can see the button. Report the exposed-versus-holdout gap inside each large slice. A blended win that is only the desktop email segment will not survive a change in the media mix.
Design holdout test
You need a switch that removes the tool without breaking the page, and a random assignment that sticks to the shopper.
- Define eligible product pages. In stock, supported type, block able to render.
- Assign each new shopper to exposed or holdout, 50/50 if you want speed, and store the arm.
- Render the preview only for exposed. Holdout sees the gallery you already trust.
- Log assignment, product view, preview start, preview complete, and order id.
- Read orders per eligible shopper after a pre-written window, with the same window on both arms.
- Wait through the return window before you talk about returns.
QA the switch with two phones on the same product. If both see the button, you are not testing. If the holdout page throws a layout hole where the button was, you are testing a broken page against a working one.
Do not recruit the holdout from people who dismissed the modal. Those people selected out. A true holdout never got the choice. That distinction is the whole design. Shopify’s A/B testing overview is the vendor-neutral version: control means the experience without the change, assigned without regard to who seems likely to buy.
Keep the product photos, price, and promo identical across arms. A simultaneous sale on the exposed template is another way to invent a lift.
Report causal limits
Even a clean holdout has a fence around it. Say what the result does not mean.
- One template, one season. A coat test in November is evidence about coats in that traffic. It is weak evidence about swim in May.
- The offer, not the tap. Intent-to-treat includes people who ignored the button. If you later analyze only people who completed a preview, you have stepped back into selection. You may do that as a description. You may not call it the effect of the offer.
- Interference. Shoppers talk, share screenshots, and use two devices. Some holdout shoppers will see a preview anyway. That usually pulls the measured gap toward zero. It does not create a fake win.
- Returns arrive late. An order readout at day seven is silent on the return rate. Publish the return read when the policy window has closed, on orders from the test, by arm.
- Appearance is the mechanism you can defend. If the gap shows up, the plausible story is that some shoppers resolved how the piece might look. The test does not show that the preview found their size. Keep the size chart in both arms so you are not withholding fit information from the holdout.
Baymard’s cart-abandonment research is a reminder that people leave for many reasons, including that they were browsing. A holdout will include those browsers on both sides, which is what you want. Removing them after the fact, because they “were never serious,” recreates the bias.
When you publish, use this shape: “Eligible shoppers who could see the preview ordered X per 100. Eligible shoppers who could not ordered Y per 100. The difference is D, and the interval is I. The 3.8% try-on-user rate is a separate description of people who completed a preview.” If you cannot fill X, Y, D, and I, you do not have a causal claim yet. You have an activity log. Say that. The on-site conversion write-up can keep the activity story. It should not be asked to carry the causal one.
Relabel the slide before the meeting
Open the deck and find every “conversion” number that comes from try-on users alone. Rename it “try-on-user conversion.” Put the eligible-shopper holdout next to it, or write “not measured.” Leave the 3.8% in the appendix with its denominator visible.
Then set the holdout up on one template. Until those two cohorts exist, the honest sentence is that eager shoppers buy more often than shoppers who never started. That sentence was true before you installed anything.
About the author: Aaron founded Antla. He has moved the 3.8% figure off more than one slide that wanted it to be the whole store.